PhonePe
HEADCOUNT Pro
At PhonePe, we built an internal platform to support annual operating planning across teams, bringing managers, planners, and leadership into a shared system.
The work sat inside a fast-moving business where planning involved multiple stakeholders, shifting inputs, and constant alignment. The focus was on creating a platform teams could rely on for planning, decision-making, and visibility as the business continued to evolve.
Project Duration: 6 months
The Challenge
Planning at PhonePe was business-critical, but the process was still spread across spreadsheets, presentations, and siloed conversations.
As planning moved across teams and business units, information became harder to consolidate, reviews slowed down, and leadership had limited visibility into how priorities and dependencies were changing.
The challenge was to turn that fragmented process into a system teams could easily work through. It needed to bring structure to planning without making it heavier, and support alignment across functions with enough flexibility.
Understanding the planning process
Planning worked in two connected layers: an annual plan set the baseline, and in-year changes continuously reshaped it. Annual planning establishes priorities, headcount, and resource assumptions for the year, while ongoing workforce planning has to absorb shifting business needs and keep hiring plans aligned to cost and capacity.
Initial planning
At the start of the financial year, teams aligned on headcount, budgets, and business priorities to create the initial plan. This was less about approvals in sequence and more about getting HR, finance, and business teams to agree on a shared baseline for the year ahead. That baseline became the reference point for everything that followed. Annual planning is commonly framed this way: a collaborative process for setting targets, allocating resources, and connecting strategy to execution.

Sets the initial plan for headcount, cost, and priorities.
Revised planning
Once the year was underway, planning became more dynamic. New asks started at team level, moved upward for alignment and approval, and then came back down into hiring execution. This is where the product had to do more than record requests — it had to show how the same need changed as it moved across managers, HR, and leadership, while keeping the revised plan in sync with the original baseline. Modern workforce planning systems explicitly support this kind of continuous adjustment, reconciliation, and scenario-driven change over time.

From team-level need to approval and hiring action.
Planning needs across teams
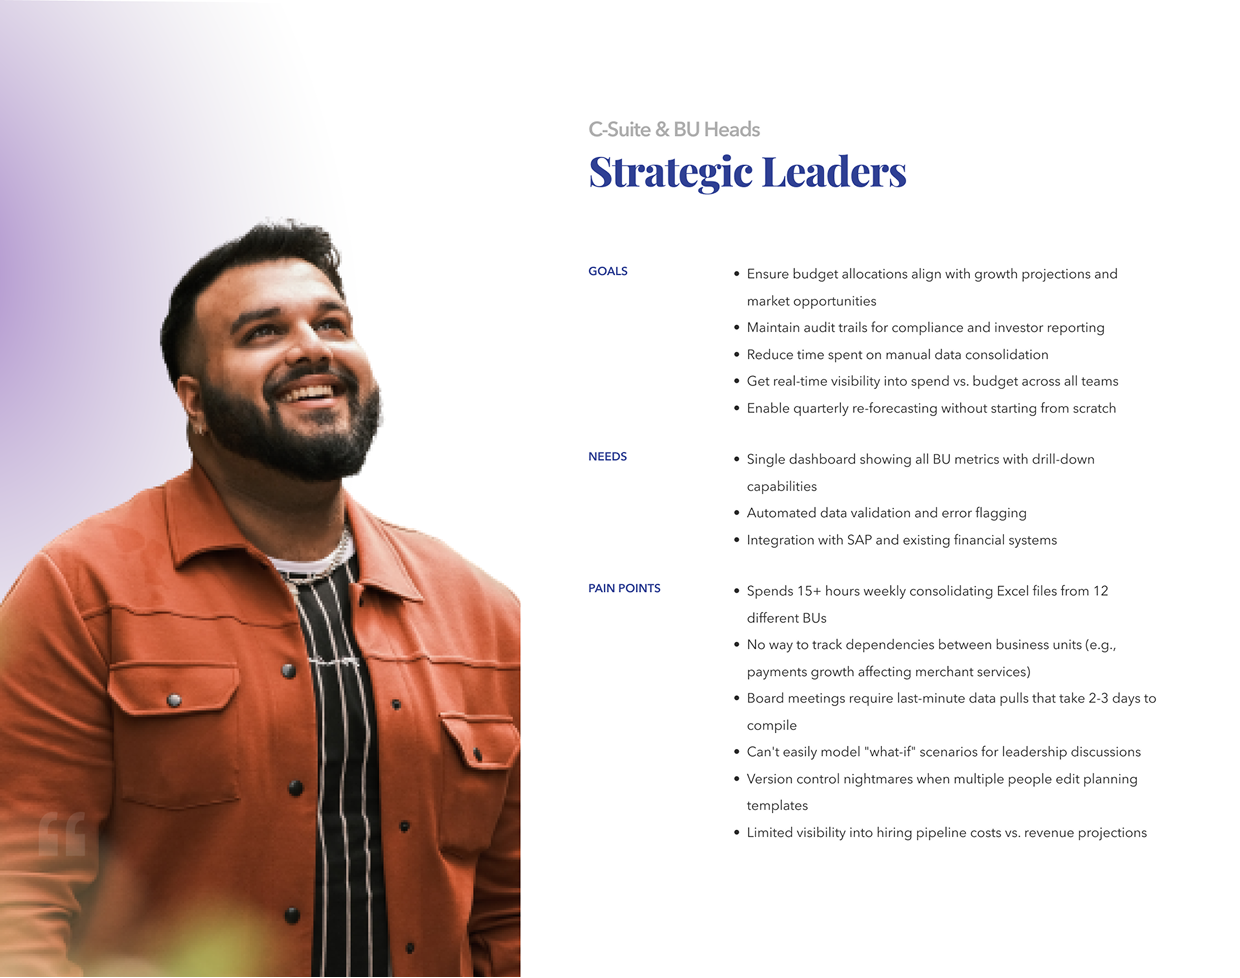


Structuring the product
The information architecture was designed to serve the 3 user types while maintaining logical data flow:
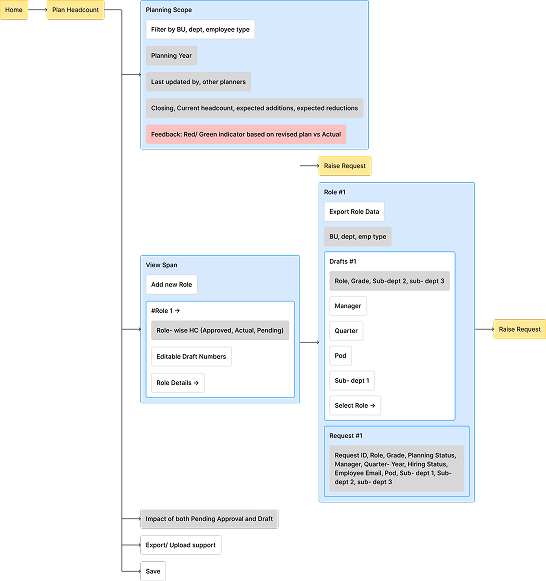
Planning Headcount
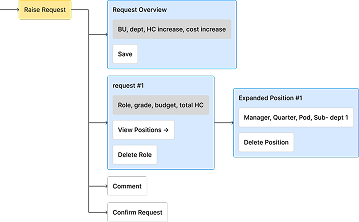
Raise Request
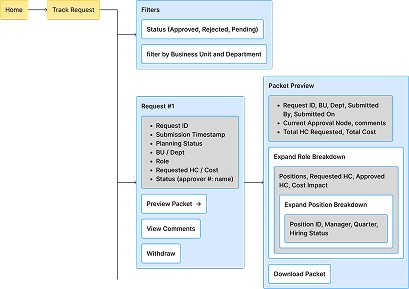
Tracking Request
Product Iterations
Each iteration responded to a different version of the problem, from managing requests, to understanding plan impact, to making the system usable across a wider group of stakeholders.
Approach 1: Request-led model
This version treated the problem as an approval flow. The screen was built around incoming requests, with approvers reviewing roles, departments, and status in a structured list.
What worked:
It made the ad hoc process easier to manage. Requests were visible, sortable, and easier to act on than before.
What didn't work:
It solved for movement, but not enough for judgment. Approvers could process a request, but didn’t have enough context to understand what that request meant for the larger plan.

Approach 2: Plan-led model
This version shifted the centre of gravity from the request to the plan itself. Instead of only showing what had come in, it tried to show how changes affected headcount, cost, and the annual baseline.
What worked:
It gave people a much better basis for decision-making. A request could now be read against the plan, not in isolation, and the financial impact was much easier to understand.
What didn't work:
It became harder to hold together once multiple people were working in it at the same time. Draft changes, approvals, and plan updates started interfering with each other, and the experience became heavier than it needed to be.
Final Iteration: Simplified User Experience
This version simplified the experience and made it clearer who needed to see what. The screen moved away from showing everything at once, and instead focused on making changes, plan movement, and comparisons easier to read.
What worked:
It was easier to understand, lighter to use, and worked better across different kinds of users. The visual summaries helped people read change more quickly, while the structure made it easier to control how much information each role needed to see.
Product Screens
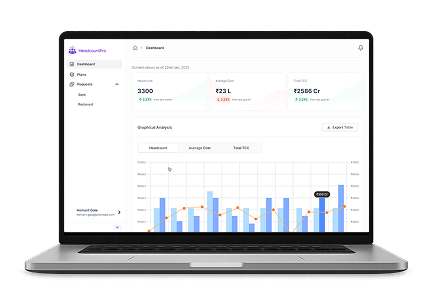
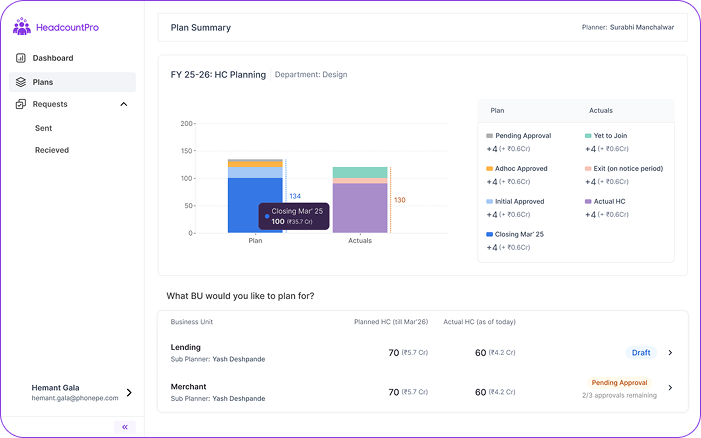
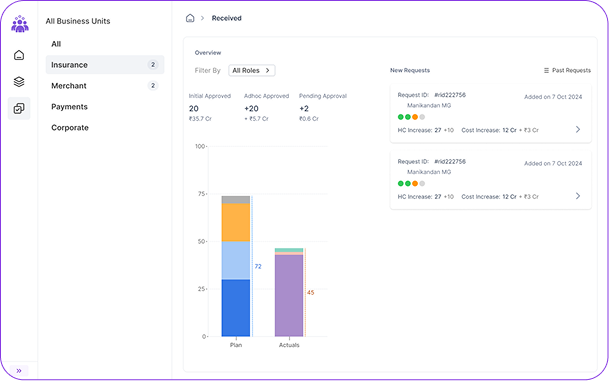
Dashboard Overview
Annual planning dashboard with multiple data visualisation sections
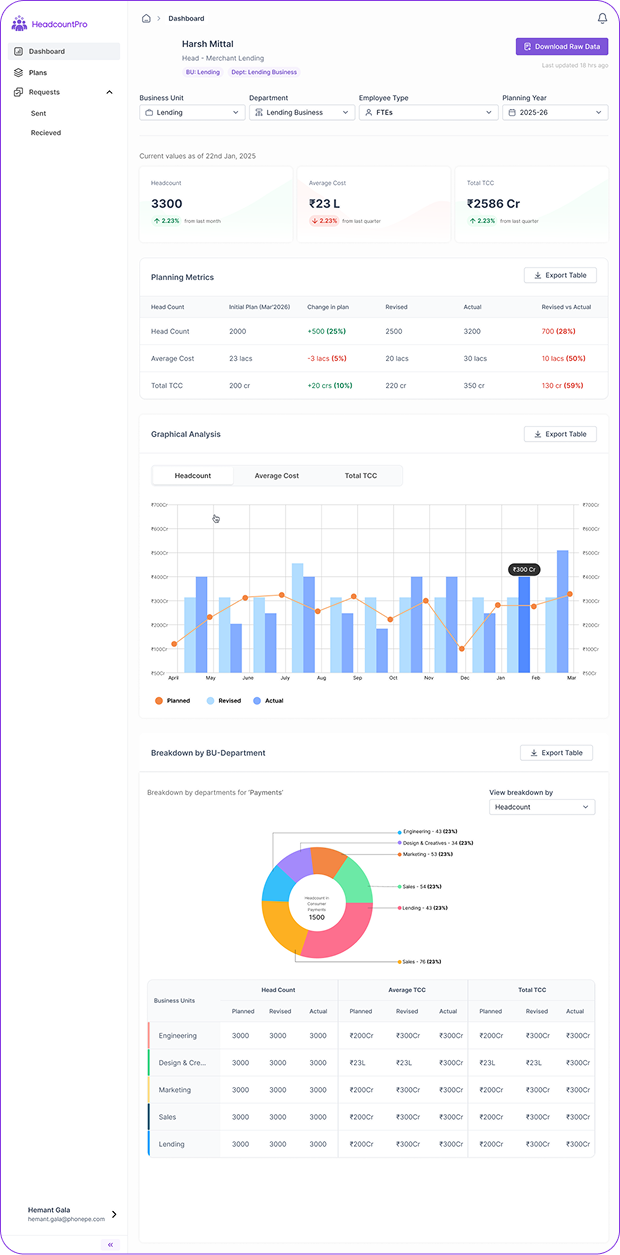
Key performance indicators showing total headcount, budget utilisation, and approval status across all business units.
Line graph displaying planned vs. actual headcount progression throughout the planning year with monthly breakdowns.
Pie chart visualising headcount allocation across different departments, enabling quick identification of resource concentration
Detailed breakdown of pending, approved, and rejected requests with department-wise categorisation.
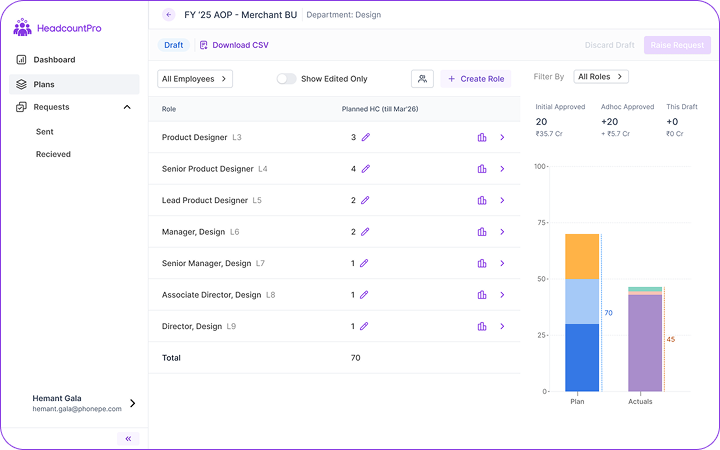
Planning Hub
Business Unit level planning interface with departmental breakdown
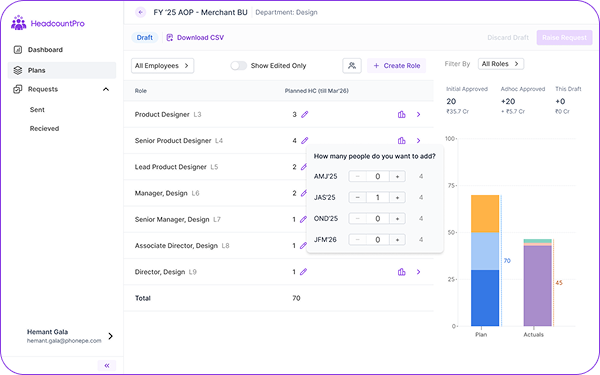
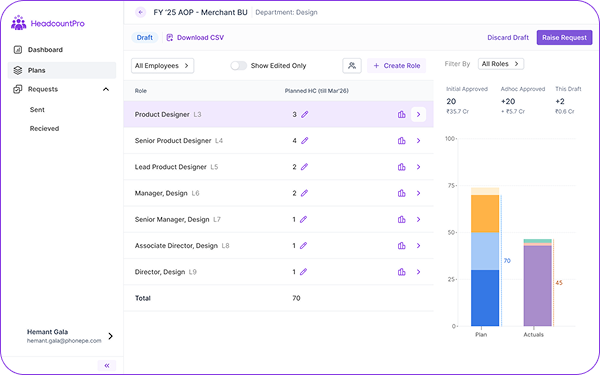
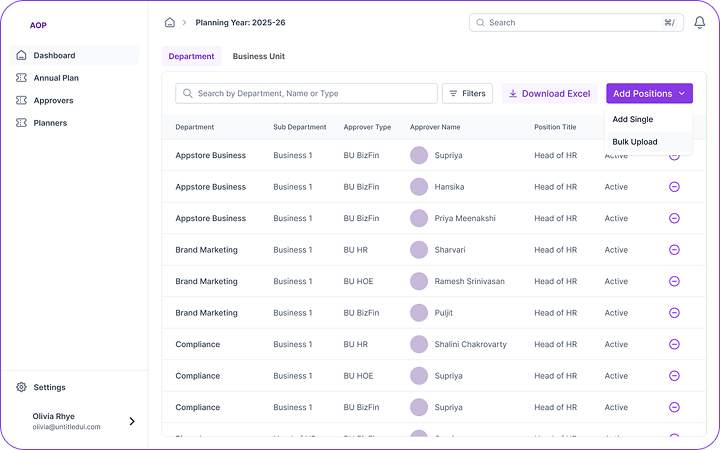
Role Planning & Request Creation
Role addition workflow- Allowing managers to specify position details, compensation bands, and justification.
Role addition workflow- Allowing managers to specify position details, compensation bands, and justification.
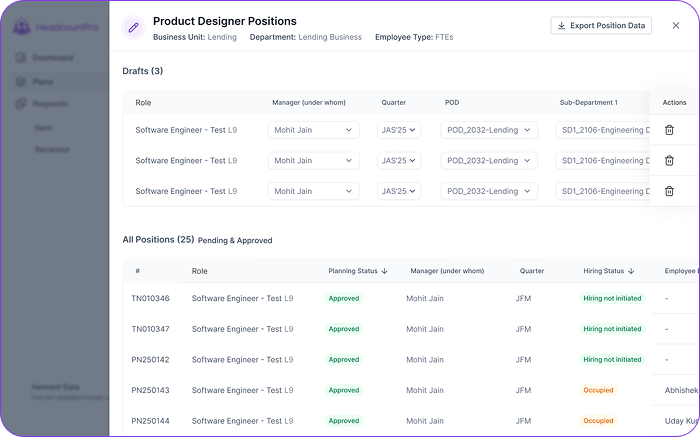
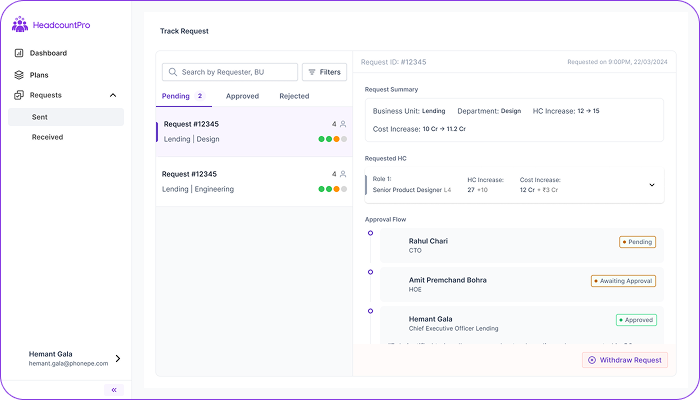
Real-time view of all submitted requests with status tracking, timeline visualisation, and priority indicators. Enables managers to monitor approval progress without follow-ups.
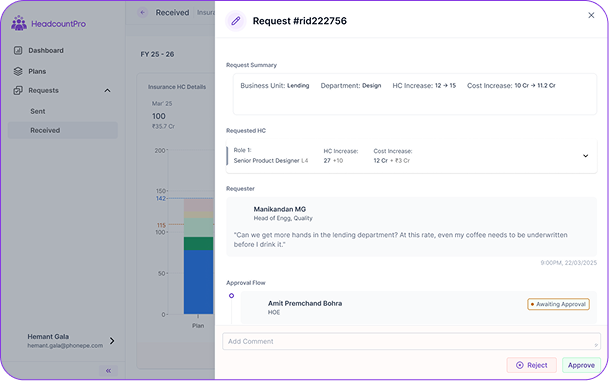
Leadership Approval Workflow
This dashboard shows all pending approvals with colour-coded indicators for quick status at a glance. Selecting a request opens a detailed view where leaders can review position info, add comments, and approve or reject efficiently, ensuring clear decisions and accountability in one place.
Results & Impact
The shift from scattered workflows to a structured planning system changed how teams approached hiring decisions.
Planning cycles became much faster, reducing from 6 weeks to 3–4 weeks, with teams able to move from alignment to execution with far less back-and-forth. Data consolidation, which previously took close to 80 hours each cycle, was reduced to around 20 hours by bringing everything into a single system.
More importantly, the product was quickly adopted across teams. Within the first quarter, all users had moved onto the platform, with minimal onboarding required. Managers and HRBPs were able to start using the system without extensive training, which was a strong signal that the product aligned well with how they already worked.
All work showcased here is my own and created in collaboration with respective teams and organisations. Some details, visuals, and identifiers may have been adapted or anonymised for confidentiality. Please do not reproduce, reuse, or distribute any part of this work without prior permission.